Experimentation
The Math Behind A/B Testing
The A/B test report calculates confidence intervals, conversion rates, and statistical significance.
If you are new to A/B testing and want an easier description of how A/B tests work without going through the math, read How A/B Testing Works.
The A/B test report
The A/B test report uses conversion and view events to calculate confidence intervals, conversion rates, and statistical significance.
An example of an A/B test report is shown below:
| Variation | Conversions / Views | Conversion rate | Change | Confidence |
|---|---|---|---|---|
| Variation A (Control) | 320 / 1064 | 30.08% +/- 2.32% | — | — |
| Variation B | 250 / 1043 | 23.97% +/- 2.18% | -20.30% | 99.92% |
In this report, significance has been reached because the confidence is above 95% and there are more than 1000 views for each variation.
- Variation reports the name of the variation for a particular row.
- Conversions / Views reports the number of conversion events received and the number of view events received.
- Conversion rate shows the percentage of views that turned into conversions as well as the confidence interval.
- Change reports the percentage change of the test variation compared to the control variation.
- Confidence reports the significance, or how different the confidence interval for the conversion rate for the test variation is when compared to the control variation.
The values used in the report are calculated as described below.
Conversion rate and conversion-rate change for variations
For each variation the following is calculated.

Conversion rate is the number of conversion events divided by the number of view events.

Percentage change compares the test variation conversion rate against the control variation.
Confidence intervals
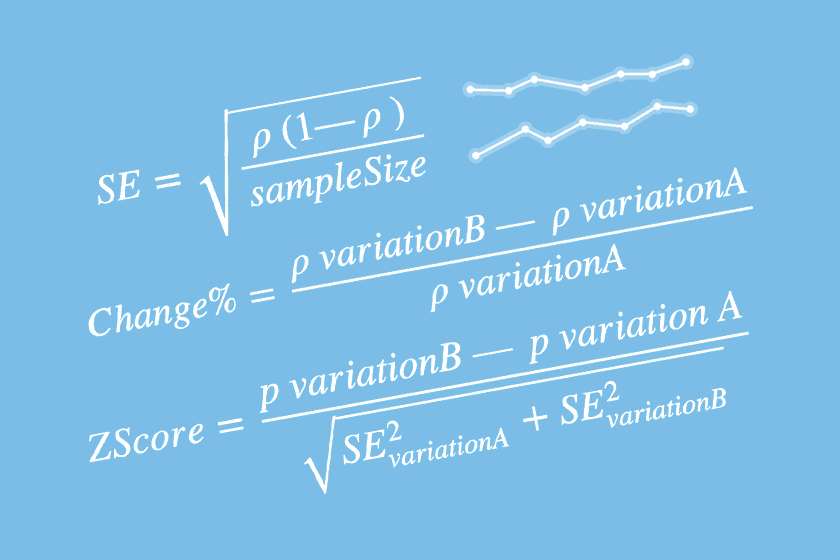
A statistical method for calculating a confidence interval around the conversion rate is used for each variation. The standard error, for one standard deviation, can be calculated with the Wald method for a binomial distribution.

Standard error gets smaller as the sample size grows, which is why confidence intervals become narrower with more data.
This formula is one of the simplest ways to calculate standard error and assumes that the binomial distribution can be approximated by a normal distribution. That approximation becomes more reasonable when there are more than 1000 view events.
To determine the confidence interval for the conversion rate, multiply the standard error by the 95th percentile of the standard normal distribution, a constant equal to 1.96.
This gives a normal-approximation interval of p +/- (1.96 x SE).
Significance
To determine whether the results are significant, meaning that the conversion rates for each variation are not different only because of random variation, a Z-score is calculated as follows:

The Z-score measures how far apart the test and control results are relative to their combined uncertainty.
The Z-score is the number of standard deviations between the control and test variation mean values. Using a standard normal distribution, 95% significance is determined when the view event count is greater than 1000 and one of the following criteria is met:
Probability(ZScore) > 95%Probability(ZScore) < 5%
Chance to be different
The chance to be different, displayed on the report, is derived from the Probability(ZScore)
value where:
- If
Probability(ZScore) <= 0.5, chance to be different =1 - Probability(ZScore) - If
Probability(ZScore) > 0.5, chance to be different =Probability(ZScore)
Next step
If this post is relevant to your work, feel free to get in touch directly.